What date basis did we use?
Donation date, transaction date, event start date, approval date, or qualification year.
Fundamentl reporting keeps the date basis, filters, records, exclusions, invoices, tags, and output format attached to the number so teams stop rebuilding reports from disconnected exports.
The product thesis
Reporting is not the chart. Reporting is the argument behind the chart.
Report ledger
Every report stores its assumptions
| Report | Date basis | Filters | Issue found | Status |
|---|---|---|---|---|
| All Giving 2025 | Donation date | Payroll, offline, credit card, match | January transactions include late 2024 gifts | Needs explanation |
| IMADD Volunteer Hours | Event start date | Two-week window, IMADD tag, office | Some events missing campaign tag | Estimate risk |
| Dollars for Doers | Qualification year | Volunteer hours, pledge status, employee | Eligibility and payout year differ | Ready |
Reporting product view
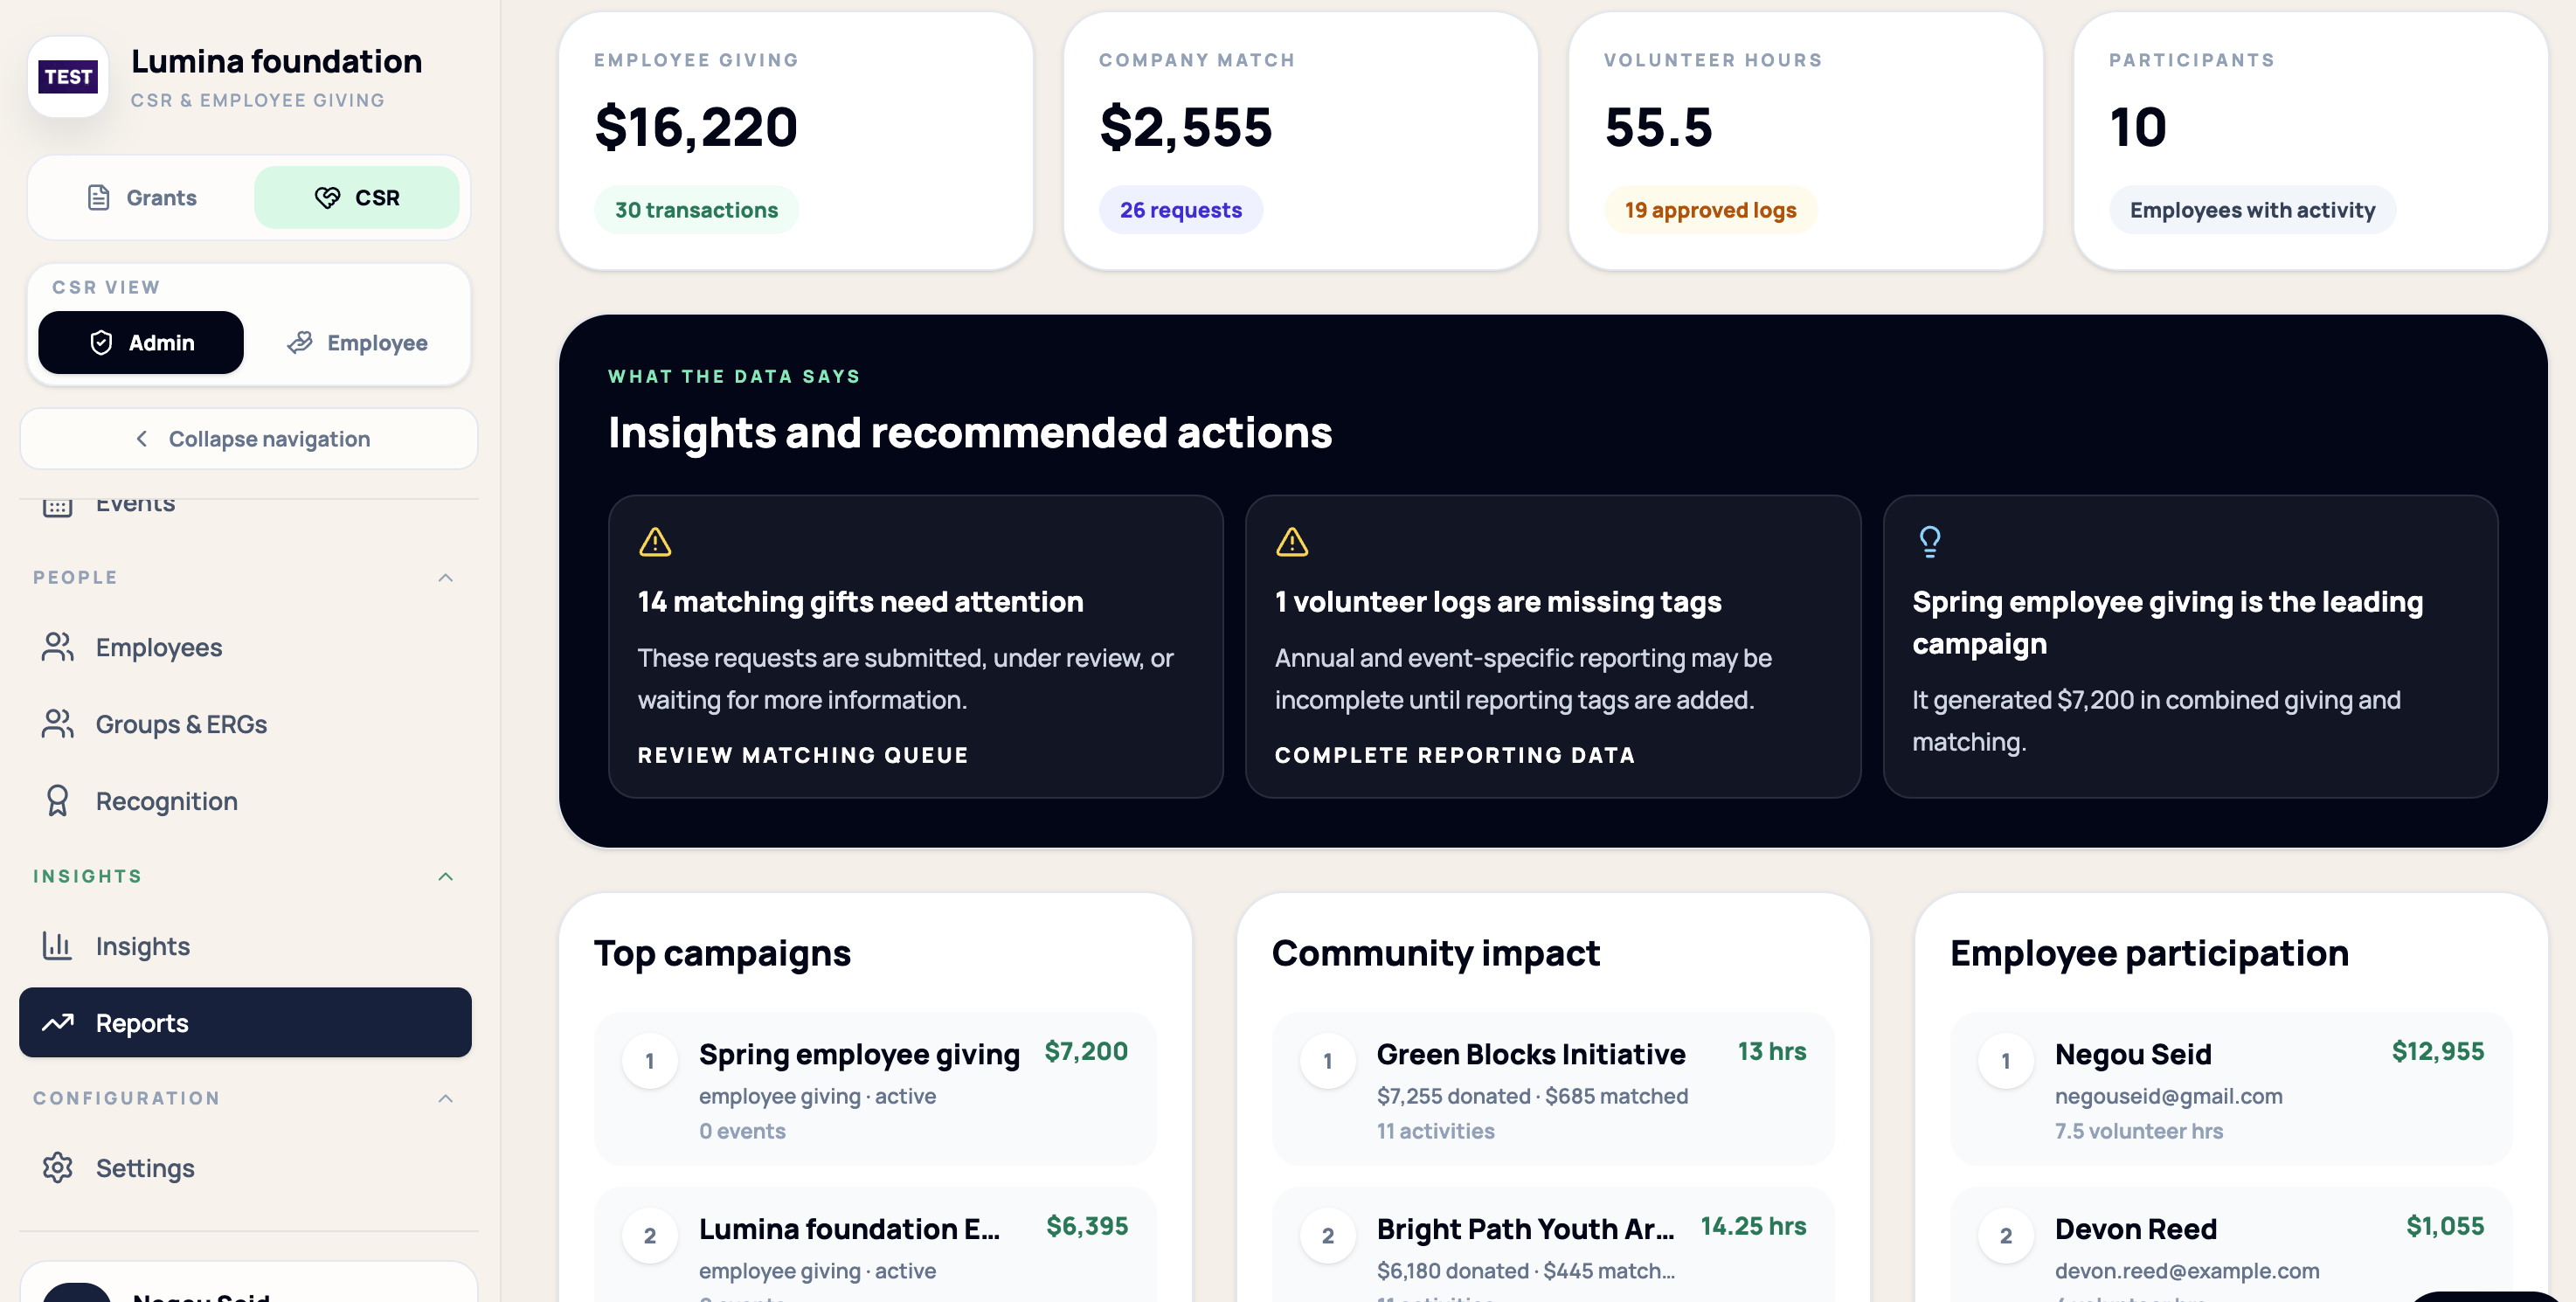
Keep employee giving, company matching, volunteer hours, campaign performance, participation, and reporting gaps explainable. Shown with sample workspace data.
Report logic
Donation date, transaction date, event start date, approval date, or qualification year.
Donation type, status, invoice, charity, tag, campaign, focus area, or location.
Missing tags, late transactions, duplicate invoices, unmatched receipts, or status conflicts.
Board, finance, CSR leader, grant committee, annual report, or public impact story.
Custom report builder
Your All Giving report, volunteer participation report, pledge report, grant cycle export, and board summary should each remember how the number was built.
Saved report recipe
Metric
Matched dollars, volunteer hours, approved grants, incentives, participation
Date basis
Donation date, transaction date, event start date, award date
Filters
Program, campaign, focus area, office, tag, status, invoice, charity
Output
Dashboard, board packet, CSV, finance export, annual summary
Explanation
Notes on exclusions, estimates, late records, or reconciliation choices
$195K
Matched dollars
Donation date basis
1,248
Volunteer hours
13 missing tags
$2.4M
Approved awards
4 reports overdue
$18.4K
Invoice mismatch
Needs finance review
Presentation ready
Fundamentl pairs visual dashboards with the saved assumptions behind them, so board, finance, and CSR teams can see both the result and the reasoning.
A better reporting demo
We will map the date basis, filters, source records, exclusions, exports, and presentation layer behind it.